
Abstract
The possibility of the existence of single-wall carbon nanotubes (SWNTs) in organic solvents in the form of clusters is discussed. A theory is developed based on abundlet model for clusters describing the distribution function of clusters by size. The phenomena have a unified explanation in the framework of the bundlet model of a cluster, in accordance with which the free energy of an SWNT involved in a cluster is combined from two components: a volume one, proportional to the number of moleculesn in a cluster, and a surface one, proportional ton 1/2. During the latter stage of the fusion process, the dynamics were governed mainly by the displacement of the volume of liquid around the fusion site between the fused clusters. The same order of magnitude for the average cluster-fusion velocity is deduced if the fusion process starts with several fusion sites. Based on a simple kinetic model and starting from the initial state of pure monomers, micellization of rod-like aggregates at high critical micelle concentration occurs in three separated stages. A convenient relation is obtained for <n> at transient stage. At equilibrium, another relation determines dimensionless binding energy α. A relation with surface dilatational viscosity is obtained.
Introduction
Among the unusual properties of fullerene solutions should be mentioned the nonmonotonic temperature dependence of solubility of fullerenes [1] and the nonlinear concentration dependence of the third-order nonlinear optical susceptibility [2]. The solvatochromic effect [3, 4] is exhibited in a sharp alteration in the spectrum of the optical absorption of C70, dissolved in a mixture of organic solvents, of a result of a slight change in the solvent content. The peculiarities in the behaviour of fullerenes in solutions are attributable to the phenomenon, predicted theoretically and revealed in experiments [5, 6], of the formation of clusters. It was examined the decrease in pyridine-soluble material observed after soaking coals in solvents, which is due to an increase in cross-linking associated with the formation of ionic domains or clusters, similar to those observed in ionomers [7]. It is not possible to extract C60-70 from a solution in toluene to water and from a dispersion in water to toluene [8]. Upon contact with water, under a variety of conditions, C60 spontaneously forms a stable aggregate  with nanoscale dimensions [9]. Water itself might form a donor–acceptor complex with C60 leading to a weakly charged colloid [10–12]. C60, dissolved in water via complexation with cyclodextrin8, was extracted to toluene [13, 14]. In C60 incorporated into artificial lipid membranes, it was not extracted to toluene, but the extraction became possible once the vesicle was destructed by adding KCl [15]. Addition of KCl was also required to extract poly(vinylpyrrolidone)-solubilized C60–70 to toluene [16].
An assembly of randomly packed spheres can represent certain features of the geometry of simple liquids [17]. Models of randomly packed hard spheres exhibited some features of the properties of simple liquids [18]. Using a new series acceleration method, the virial expansion for the pressure of hard discs and hard spheres was found to be a monotonically increasing function of the number density ρ and diverged at the density of closest packing with the critical exponent γ = 1 [19]. The general problem of open packing of spheres is difficult, since the answers depend on the assumptions about the local connectivity. At the purely mathematical level the only thing that counts is that there is continuity from one sphere to the next. From the engineering viewpoint of the stability of a pile of dust particles or a rime of ice crystals, each particle must be in contact with several other particles but not with crystallographic regularity. An open packing of spheres must be regular, at least in two dimensions, and preference is given to arrangements that are related to (4;2)-connected three-dimensional (3D) nets. The problem of stability is difficult because it involves chemical bonding. From the viewpoint of simple ionic bonding, any open packing, in general, is not electrostatically stable with respect to a more compact one. Material encapsulated during synthesis can promote stability of open frameworks, but removal of the encapsulated material should result in collapse of the framework as the minimum of electrostatic energy is favoured. From the viewpoint of ionic plus covalent bonding, open structures can persist metastably if bonds remain unbroken. The safest approach, in considering nets with extremely low density, is to look first at all theoretical possibilities, irrespective of chemical implications, and then to look at the complex topochemical possibilities. Low-density sphere packings were invented for a continuous, locally symmetric arrangement, in which each line joining the points of contact of successive spheres passes through the centres of the spheres. The most open packing has 94.4% void space. The line-centre restriction is critical to mechanical stability of a sphere packing, but is not necessary for chemical stability. Replacement of one sphere by a triangle of three spheres is an important technique for creating new packings. Relaxation of the stability criterion allows invention of sphere packings of even lower density, including ones with 95.5 and 95.8% void space. In earlier publications the bundlet model for clusters of SWNTs was presented [20–22]. The aim of the present report is to perform a comparative study of the properties of fullerenes (droplet model) and SWNTs (bundlet model). A wide class of phenomena accompanying the behaviour of SWNTs in solutions is analyzed from a unique point of view, taking into account the tendency of SWNTs to cluster formation in solutions. Based on the droplet model of C60-70, the bundlet model of SWNTs and droplet model of single-wall carbon nanoholes (SWNHs) are proposed.
Computational Method
Solubility of Single-wall Carbon Nanotubes
A new solubility mechanism is based on the possibility of formation of SWNT clusters in solution. Aggregation changes SWNT thermodynamic parameters in solution, which displays the phase equilibrium and changes the magnitude of solubility. The thermodynamic approach to the description of SWNT solubility is based on the bundlet model of clusters, which is valid under conditions when the characteristic number of SWNTs in the cluster n ≫ 1. Let us formulate the problem of determining the temperature dependence of SWNT solubility in terms of the possibility of forming clusters of several parallel SWNTs. In a saturated SWNT solution, the magnitudes of the chemical potential per SWNT for dissolved substance and for a crystal are equal, which is in equilibrium with solution. The equality is valid not only for isolated SWNTs in a solution but also for SWNT clusters. According to the bundlet model of clusters the free energy of a cluster in a solution is made up of two parts: the volume part, proportional to the number of SWNTs n in the cluster, and the surface one, proportional to n 1/2 [23–25]. The model corresponds to the assumption that clusters consisting of n ≫ 1 particles have a cylindrical bundlet shape and permits the Gibbs energy G n for a cluster of size n to be represented as the sum

where parameters  are responsible for the contribution to the Gibbs energy of molecules placed inside the volume and on the surface of a cluster, respectively. The chemical potential μ
n
of a cluster of size n in a solution is expressed via
are responsible for the contribution to the Gibbs energy of molecules placed inside the volume and on the surface of a cluster, respectively. The chemical potential μ
n
of a cluster of size n in a solution is expressed via

where T is the temperature. Having regard to Eq. 1, this results in

where parameters  are expressed in temperature units. In a saturated solution of SWNTs, the cluster-size distribution function is determined via the equilibrium condition linking the clusters of a specified size with a solid phase, which corresponds to the equality between the magnitudes of the chemical potential (per molecule) for molecules incorporated into clusters of any size and into crystal, resulting in the expression for the cluster-size distribution function in a saturated solution:

where parameter A is the equilibrium difference between the energies of interaction of an SWNT with its surroundings in the solid phase and in the cluster volume, B, the similar difference for SWNTs located on the cluster surface, g n , the statistical weight of a cluster of size n, which depends on both temperature and cluster size n. However, we shall neglect these dependences in comparison with the much stronger exponential dependence in Eq. 4. The presented form (4) for the cluster-size distribution function is based on SWNT structural features. An SWNT is a homogeneous surface structure that, unlike planar or elongated molecules, interacts with its surroundings almost irrespective of the orientation about its axis. The large number of similar elements of the SWNT surface makes it possible to represent the interaction energy of this molecule and the solvent molecules, having essentially smaller size, as the product of a specific surface interaction energy by surface area of the molecule. The feature of the SWNT structure may be further used in the description of the interaction between clusters, made up of SWNTs, and the solvent. This is purely surface interaction and, because the interaction energy of SWNTs with one another, both in a cluster and in a solid is low in comparison with the binding energy of C atoms in an SWNT, one can assume that the specific surface energy of interaction of SWNTs with one another and with solvent molecules is not sensitive to the relative orientation of parallel SWNTs in a cluster. Parameters A and B may have any sign. However, the normalization condition for distribution function (4)

requires A > 0. Here C is the solubility in relative units. As n ≫ 1 normalization (5) may be replaced by integral

Here  is the statistical weight of a cluster averaged over the range of n that makes the major contribution to integral (6), and C
0, the SWNT molar fraction. The A B and C
0 have been taken equal to those for C60 in hexane, toluene and CS2: A = 320 K, B = 970 K, C0 = 5 × 10⁻⁸ (molar fraction) for T > 260 K. A correction has been introduced to take into account the different packing efficiencies between C60 and SWNTs
is the statistical weight of a cluster averaged over the range of n that makes the major contribution to integral (6), and C
0, the SWNT molar fraction. The A B and C
0 have been taken equal to those for C60 in hexane, toluene and CS2: A = 320 K, B = 970 K, C0 = 5 × 10⁻⁸ (molar fraction) for T > 260 K. A correction has been introduced to take into account the different packing efficiencies between C60 and SWNTs

where ηcyl = π/2(3)1/2 is the packing eficiency of cylinders, and ηsph = π /3(2)1/2, that of spheres (face-centred cubic, FCC). The trend of SWNTs in solution to form clusters is reflected in the parameters governing their properties. The dependences of the cluster-size distribution function on solution concentration and temperature lead to the dependences of thermodynamic–kinetic parameters characterizing SWNT behaviour. For an unsaturated solution a solid phase is absent, so that the distribution function is determined via equilibrium condition for clusters. Using Eq. 3, one can obtain the distribution function in the unsaturated SWNT solution depending on concentration:

Here parameter λ depending on the concentration of a solution is determined via normalization condition

C 0 defines the absolute concentration, can be found by requiring that determined via Eq.9 to be saturated (Eq. 5) and is taken as 10−4 mol L−1. The formation energy of a cluster consisting of n SWNTs is determined by

Using the expression for the cluster-size distribution function, one obtains the formula governing the thermal effect of SWNT solution per mole of dissolved substance:

where λ is determined by the total concentration of formed solution via normalization condition (Eq. 9).
Transfer Phenomena in Single-wall Carbon Nanotube Solutions
The diffusion coefficient is a parameter characterizing the behaviour of fullerenes and SWNTs in solution, which governs their optimum conditions of crystallization, separation and purification. Their diffusion coefficients have a simple estimate in Stokes formula describing the diffusion of a spherical particle in a viscous fluid:

Here k is Boltzmann constant, T, the temperature of the liquid, η, the dynamic viscosity coefficient, and r s , the particle radius. The validity of the equation can be reduced to the requirement of low Reynolds number for a diffusing particle:

where  is the particle characteristic velocity, m, its mass, and ρ, the solvent mass density. Using the relation between the mass of a particle and its radius, the expression provides the minimum radius of a diffusing particle

where ρ p is the particle mass density. Using the characteristic viscosity coefficients of typical organic solvents η∼(1−3) × 10−3 N s m−2, one obtains that limitation (13a) is reduced to r s ≫ 10−12 m, which is valid for practical purposes. Radii r s , determined by Eq. 12 from experimental data for the diffusion coefficient of fullerenes in various solvents, substantially exceed the radius of a C60 molecule r s = 0.35 nm. The differences in the radii obtained for different solvents may be attributed to fullerene-SWNT aggregation in solution; the effect is universal. The existence of these systems in solution in the form of clusters, whose average size depends on the concentration of solution, suggests the dependence of their diffusion coefficient on concentration [26]. For low concentration almost no clusters are formed, and their diffusion coefficient is close to the value for a fullerene or SWNT. As the concentration of fullerenes in solution rises, the average cluster size increases and their diffusion coefficient decreases in accordance with Eq. 12. For SWNTs in solution the cluster-size distribution function for saturation is expressed via Eq. 4, whereas for an unsaturated solution, via Eq. 8. Let us determine SWNT diffusion coefficient D in solution based on

Here J is the flux of matter in solution under the action of concentration gradient. In view of the cluster origin of SWNT solubility one represents Eq. 14:

where J n D n and C n are the partial values of the flux, diffusion coefficient and concentration of the cluster of size n, respectively. We shall derive the relationship between diffusion coefficient D n of the cluster of size n and its radius r n , based on the bundlet model, Stokes Eq. 12 and relations

where M is the fullerene molecular mass, and ρ, the cluster density. By combining Eqs. 1416 and using the cluster-size distribution function (8), one derives the expression for the SWNT diffusion coefficient for cluster formation:

Here D
0 is the diffusion coefficient of an SWNT. Parameter D
0 has been taken equal to that for C60 in toluene: D
0 = 10−9 m2· s−1 at T
o = 295.15 K corrected as  for T ∼ T
o. The concentration dependence of the cluster-size distribution function points to a concentration dependence of SWNT diffusion coefficient, which complicates its kinetic behaviour. If a solution contains a mixture of different sorts of SWNTs, the character of the diffusion of SWNTs of a given sort is determined by their propensity to cluster formation. The SWNTs comprising a small admixture to the basic substance do not practically form clusters and are characterized by the diffusion coefficient, which is inherent to SWNT units. The SWNTs of basic substance whose concentration is close to saturated have a trend to aggregation. The diffusion coefficient for this substance exceeds that for an SWNT unit and exhibits the decreasing temperature dependence. The difference in the diffusion coefficients of SWNTs of different sorts makes thinking of developing the diffusion methods of SWNT enrichment, separation and purification. The SWNT that is present in solution as a minor impurity and does not form clusters must have a higher diffusion coefficient than that SWNT whose concentration is close to saturated and that is present in the form of large clusters. We shall assume that the source of SWNTs is provided by a plane layer of a solid material constituting the mixture of SWNTs of two sorts, in which SWNTs of a certain sort predominate whereas the molecules of the other sort make up only a minor impurity [27]. One can assume that the molecules of minor impurity form almost no clusters and are characterized by SWNT diffusion coefficient D
0. The diffusion coefficient of SWNTs of the predominating sort depends on concentration and, due to the possibility of forming clusters in solution, is lesser than that of isolated SWNTs. The diffusion equations for SWNTs of the predominating sort (concentration C
1) and of the minor impurity (C
2) have the standard form
for T ∼ T
o. The concentration dependence of the cluster-size distribution function points to a concentration dependence of SWNT diffusion coefficient, which complicates its kinetic behaviour. If a solution contains a mixture of different sorts of SWNTs, the character of the diffusion of SWNTs of a given sort is determined by their propensity to cluster formation. The SWNTs comprising a small admixture to the basic substance do not practically form clusters and are characterized by the diffusion coefficient, which is inherent to SWNT units. The SWNTs of basic substance whose concentration is close to saturated have a trend to aggregation. The diffusion coefficient for this substance exceeds that for an SWNT unit and exhibits the decreasing temperature dependence. The difference in the diffusion coefficients of SWNTs of different sorts makes thinking of developing the diffusion methods of SWNT enrichment, separation and purification. The SWNT that is present in solution as a minor impurity and does not form clusters must have a higher diffusion coefficient than that SWNT whose concentration is close to saturated and that is present in the form of large clusters. We shall assume that the source of SWNTs is provided by a plane layer of a solid material constituting the mixture of SWNTs of two sorts, in which SWNTs of a certain sort predominate whereas the molecules of the other sort make up only a minor impurity [27]. One can assume that the molecules of minor impurity form almost no clusters and are characterized by SWNT diffusion coefficient D
0. The diffusion coefficient of SWNTs of the predominating sort depends on concentration and, due to the possibility of forming clusters in solution, is lesser than that of isolated SWNTs. The diffusion equations for SWNTs of the predominating sort (concentration C
1) and of the minor impurity (C
2) have the standard form


Here D 1 and D 2 denote the diffusion coefficients for the first and second components, respectively. Equations 1819 have automodelling solutions dependent on the single variable x/t 1/2; however, for the concentration dependence of the diffusion coefficient the solution calls for numerical calculations. Equation 18 was solved with the initial conditions

which correspond to one-dimensional (1D) diffusion from an instantaneously actuated plane source. Here  is the saturated concentration of SWNTs in solution. The solution of Eq. 19 with the initial conditions

is known quite well at  :
:

where K is the normalization factor. The solutions to Eqs. 1819 were reported in the form of spatial dependences of SWNT enrichment factor η defined as

We have neglected the difference between the diffusion coefficients of isolated SWNTs of different sorts, which is due to size variation. The enrichment factor of SWNTs some time-dependent distance x
* away from the source assumes the maximum η
m
. Due to the automodelling character of the solutions of Eqs. 1819 η
m
is time independent and  The obtained results permit imagining the possible schemes of SWNT diffusion enrichment in solution. It appears appropriate the experience accumulated in the development of isotope separation. We shall consider nonstationary diffusion. A container filled with a solvent is divided into two parts, with a porous partition that does not retard the diffusion motion of dissolved molecules, but prevents convective stirring of the solution in two parts. A SWNT solid mixture with a minor impurity of higher SWNTs is placed at the bottom of one of the parts. Due to the difference in the diffusion coefficients of SWNTs of different sorts, the SWNT mixture penetrating into the second part of the container must be highly enriched with the minor impurity. After a lapse of time corresponding to the maximum value of the enrichment factor for the given system geometry, the second part of the container filled with the enriched solution rapidly drains. The SWNT extract is enriched with the minor impurity in a single-action mode. The diffusion scheme of SWNT enrichment is more convenient in the stationary mode. An elementary separation cell consists of two volumes divided by a porous partition. An initial solution containing SWNTs of two sorts is slowly pumped via one part of the cell. A pure solvent is pumped in the opposite direction via the other part of the cell. Because of diffusion via the porous partition, the solution in the second part of the cell is enriched with the minor impurity. The maximum enrichment factor corresponds to the ratio between the diffusion coefficients for the two components. Because this ratio is ca. 1.3 a multistage system must be used to attain a more significant enrichment factor. The relationship between the resultant enrichment factor η
f
and the number m of stages is
The obtained results permit imagining the possible schemes of SWNT diffusion enrichment in solution. It appears appropriate the experience accumulated in the development of isotope separation. We shall consider nonstationary diffusion. A container filled with a solvent is divided into two parts, with a porous partition that does not retard the diffusion motion of dissolved molecules, but prevents convective stirring of the solution in two parts. A SWNT solid mixture with a minor impurity of higher SWNTs is placed at the bottom of one of the parts. Due to the difference in the diffusion coefficients of SWNTs of different sorts, the SWNT mixture penetrating into the second part of the container must be highly enriched with the minor impurity. After a lapse of time corresponding to the maximum value of the enrichment factor for the given system geometry, the second part of the container filled with the enriched solution rapidly drains. The SWNT extract is enriched with the minor impurity in a single-action mode. The diffusion scheme of SWNT enrichment is more convenient in the stationary mode. An elementary separation cell consists of two volumes divided by a porous partition. An initial solution containing SWNTs of two sorts is slowly pumped via one part of the cell. A pure solvent is pumped in the opposite direction via the other part of the cell. Because of diffusion via the porous partition, the solution in the second part of the cell is enriched with the minor impurity. The maximum enrichment factor corresponds to the ratio between the diffusion coefficients for the two components. Because this ratio is ca. 1.3 a multistage system must be used to attain a more significant enrichment factor. The relationship between the resultant enrichment factor η
f
and the number m of stages is

where η0 is the enrichment factor for a single cell. The method appears most convenient in the enrichment of a solution containing the mixture of a short SWNT with a minor impurity of larger SWNTs. The temperature–concentration dependences of the cluster-size distribution function show the possibility of a new mechanism of SWNT thermal diffusion in solution. We shall define SWNT thermal diffusion coefficient D T in solution by the relation between the thermal diffusion flux J T and the temperature gradient [28, 29]

We shall assume that the time required for equilibration of the cluster-size distribution function, defined by Eqs. (4–8), is much lesser than that required for smoothing spatial temperature nonuniformities. By Eqs. 4–8 the temperature gradient in solution causes gradients in partial concentrations of clusters, which in turn causes diffusion flows proportional to temperature gradient. The partial diffusion flux of clusters of size n due to temperature gradient is

where the cluster-size distribution function f(n) is given by Eq. 4 or 8, depending on whether the solution is saturated or not. It is assumed that the main temperature dependence of the cluster-size distribution function is in the exponential factor. The net diffusion flux is calculated via the integration of Eq. 25 over n, which permits using Eq. 24 to determine the thermal diffusion coefficient. The diffusion coefficient D n of clusters of size n in solution will be determined again using Stokes Eq. 12, which describes experimental data. The expression for SWNT thermal diffusion coefficient in solution is

The results of calculations, performed for different values of temperature and concentration of the solution of SWNTs in toluene, on the basis of the cluster-size distribution functions (4–8) using Eqs. 12, 25 and 26, showed thermal diffusion, which is a consequence of SWNT aggregation in solution. Only one of the possible mechanisms of SWNT thermal diffusion was treated, which is inherent to fullerenes-SWNTs. Another more general mechanism shows up even in the case of fullerene-SWNT units, which is caused by the larger size of a solute unit as compared with the solvent molecule. For the latter in a temperature gradient, a fullerene molecule is subjected to the action of a force that is proportional to the pressure difference acting from the side of fluid on the two opposing hemispheres of the molecule, which causes a directed drift of molecules whose velocity w may be estimated via Stokes formula

where r is the radius of the fullerene molecule, which results in the estimation of the thermal diffusion coefficient:

Equation 26 differs from the estimate by a factor (−An + Bn 1/2)/T ≫ 1. Under conditions favourable to cluster formation the thermal diffusion mechanism, associated with SWNT aggregation in solution, proves much more efficient as compared with the more general mechanism.
Fractal Structures in Single-wall Carbon Nanotube Solutions
The trend to aggregation of fullerenes-SWNTs in solution manifests in the formation of clusters. Experimental data show that in parallel with small-sized clusters, which form practically in a moment in these solutions, it is possible the formation of large-sized clusters, growing during several months and containing up to several hundred thousands of units. The large cluster growth kinetics in solution was experimentally studied in detail. A solution of C60 in benzene at concentration  which is several times lower than the saturated magnitude, was studied at room temperature using static (SLS) and dynamic light scattering (DLS). The SLS provides the correlation between the relative variation of radiation intensity scattered at a given angle, due to the existence of dissolved matter in solution, and the average mass of particles in this matter, providing the determination of the average mass of fullerene-SWNT clusters. The DLS consists in measuring the spectral line width of scattered radiation due to the Brownian motion (BM) of particles in solution. Because the characteristic velocity of particle BM is inversely proportional to the mean particle radius, this permits the derivation of information on the dimensions of dissolved particles. By combining SLS with DLS one can investigate the dynamics of growth of aggregates in solution, and determine the relation between the mass and size of a cluster. Fullerenes in benzene form fractal aggregates with a fractal dimension ∼2.1. The growth of such structures was observed over a period up to 100 days. The formed structures are unstable and are destroyed by the light shaking of solution, after which the formation and growth of fractal structures is restarted. The growth dynamics of fractal structures gave the measured hydrodynamic radius R
h
of fractal clusters as a function of time. The behaviour of cluster growth depends on solution preparation. The data correspond to the case when the solution was prepared in the open air. If the solution was prepared in
which is several times lower than the saturated magnitude, was studied at room temperature using static (SLS) and dynamic light scattering (DLS). The SLS provides the correlation between the relative variation of radiation intensity scattered at a given angle, due to the existence of dissolved matter in solution, and the average mass of particles in this matter, providing the determination of the average mass of fullerene-SWNT clusters. The DLS consists in measuring the spectral line width of scattered radiation due to the Brownian motion (BM) of particles in solution. Because the characteristic velocity of particle BM is inversely proportional to the mean particle radius, this permits the derivation of information on the dimensions of dissolved particles. By combining SLS with DLS one can investigate the dynamics of growth of aggregates in solution, and determine the relation between the mass and size of a cluster. Fullerenes in benzene form fractal aggregates with a fractal dimension ∼2.1. The growth of such structures was observed over a period up to 100 days. The formed structures are unstable and are destroyed by the light shaking of solution, after which the formation and growth of fractal structures is restarted. The growth dynamics of fractal structures gave the measured hydrodynamic radius R
h
of fractal clusters as a function of time. The behaviour of cluster growth depends on solution preparation. The data correspond to the case when the solution was prepared in the open air. If the solution was prepared in  the measured value of the hydrodynamic radius was ca. 20% higher. The average radius of the fractal cluster at the end of the observation period reaches ∼ 170 nm. In view of the relation between the fractal dimension of a cluster D, its radius R and its number of particles n, i. e.,

where r 0 is the radius of the fullerene molecule, one derives that the maximum number of particles in the cluster attained during the observation time of ∼4 × 10⁶ s is ∼105. In a simple model consider an elementary act of coalescence of two particles in a solution under condition (13), when the characteristic value of the Reynolds number for thermal motion of a dissolved molecule is Re ≪ 1 [30]. The BM can be described in Stokes–Einstein–Smoluchowski approach. Constant k for the aggregation of particles in solution is defined by the diffusion mechanism and expressed by

Here r 1 and r 2 are the particle radii, and D 1 and D 2, their diffusion coefficients in solution. Using Stokes Eq. 12 for particle diffusion coefficient in solution, one derives the rate constant of particle coalescence:

where the function

is  for
for  and
and  for r
1 ≫ r
2. The typical value for SWNT saturated concentration in most widely used solvents, corresponding to solubility at room temperature, is N
0∼1018 cm−3. Their characteristic dynamic viscosity coefficient is η ∼ 0.01 P. The rate constant for coalescence of two SWNTs-clusters of comparable sizes is ∼ 10−12 cm3 s−1, which corresponds to the characteristic time of the attachment process under diffusion approach
for r
1 ≫ r
2. The typical value for SWNT saturated concentration in most widely used solvents, corresponding to solubility at room temperature, is N
0∼1018 cm−3. Their characteristic dynamic viscosity coefficient is η ∼ 0.01 P. The rate constant for coalescence of two SWNTs-clusters of comparable sizes is ∼ 10−12 cm3 s−1, which corresponds to the characteristic time of the attachment process under diffusion approach  The time required for the equilibrium-size distribution function of small clusters is of the same order. The real time of the growth of fractal clusters (∼ 106 s) exceeds the estimation result by many orders of magnitude. In describing the growth kinetics of SWNT fractal structures in solution, one must take into account growth mechanism. We shall employ the simple growth models of fractal structures, which are based on the invariability assumption of cluster fractal dimension in its growth process. The simplest model of fractal cluster growth is diffusion-limited cluster aggregation (DLCA). In DLCA cluster aggregation is a result of the attachment of the clusters of comparable sizes. The rate constant is determined from Eqs. 3032 and is virtually independent of cluster size. The growth kinetics of fractal clusters with the average number of particles n is

The right side of Eq. 33 is independent of n because the concentration of clusters of size n is N 0/n, while the attachment of the cluster of size n to the given cluster results in an increase of its size by n. The rate of cluster growth is proportional to the product of both factors and is equal to N 0 k. In view of Eq. 29 the DLCA equation of the growth kinetics of a fractal cluster of average size n is

The time required to increase the fractal cluster radius by a factor of 500 is ∼1 s, which differs from the measurement results by six orders of magnitude; DLCA does not apply to experimental conditions. Another model used to describe fractal structure growth is diffusion-limited aggregation (DLA). In DLA cluster growth is the result of attachment to a given cluster of individual particles (SWNTs or small SWNT clusters). If the initial number densityN 0of SWNTs in solution and average concentrationN c of growing clusters are time-independent, one derives the equation describing the time variation of the average cluster sizen:

Here in accordance with Eqs. 29–32 one has

The form of Eq. 35 is independent of the size of a small cluster attaching to a large cluster of size n. Let the number of SWNTs in a small cluster be equal to n s , and the concentration of clusters of this size, N s . The growth rate of large clusters because of the attachment of the small clusters of size n s is written as

The summation of this expression over all valuess≪n in view of the obvious normalization condition

provides Eq. 33. The growth rate of large fractal clusters does not depend on the shape of the size distribution function of small clusters. The feature is caused by the form of the cluster size dependence on the attachment rate constant (32), which in the limiting case of clusters of highly differing sizes does not depend on the size of the smaller cluster. The solution of Eq. 33 with the initial condition n(t = 0) = 1 has the form:

Here  is the maximum number of particles in a cluster. Equation 39 is simplified for D = 2:

where  is the maximum cluster radius, and
  . In accordance with Eq. 40 the characteristic time of cluster growth is
  . The conclusion does not correspond to experiment. Because the dependence R(t) is close to saturation at the last growth stage one may assume that
  . The
. The  , and the characteristic time of cluster growth is estimated as
  . Because the measured value of this time exceeds the estimation result by nine orders of magnitude, one concludes that DLA is unsuitable for the description of the experimentally examined growth of SWNT fractal clusters in solution. Another model used to describe fractal cluster growth is reaction-limited cluster aggregation (RLCA). In RLCA the cluster growth is a result of the attachment of clusters of different sizes, with the attachment probability of approaching clusters being γ ≪ 1, so that for a pair of clusters to attach they must undergo a large number of collisions. The equation describing the cluster growth kinetics in RLCA is

where R 1 and R 2 are the radii of approaching clusters, and μ, their reduced mass. Using Eq. 29 and averaging Eq. 41 over the cluster-size distribution function one derives

Here r 0 is the fullerene molecular radius, and m 0, its mass. Dimensionless coefficient J depends on the cluster-size distribution function and cluster fractal dimension D. The J = 6.8 for D = 2, and the simplest form of the function,

where n 0 is the average number of particles in the cluster. Integration of (42) results

The RLCA leads to an unlimited growth of the cluster radius with time. Because  dependence (44) is close to linear. Such a dependence differs from the experimental curve, which permits concluding that RLCA is not applicable to the growth of fractal SWNT clusters in solution. A satisfactory agreement between the calculated and measured evolution of fractal cluster growth can be reached because of RLCA modification: let us assume that cluster attachment probability γ depend on cluster size

This results in the expression

Equation 46 calculated for D = 2.08, α = 2, and γ0 = 10−7 showed that the dependence agrees quite well with experiment. The calculated dependence almost coincides with the calculation result within the simplified model with D = 2.
Real-space Imaging of Nucleation and Growth in Colloidal Crystallization
In colloidal crystallization, competition between the surface and bulk energies is reflected in the free energy for a spherical crystallite

where R is the radius, γ, the surface tension, Δμ, the difference between the liquid and solid chemical potentials, and N, the number density of particles in the crystallite [31]. The size of the critical nucleus is R
c
= 2γ/(Δ μ N), corresponding to the maximum of ΔG (Eq. 47). The radius of gyration R
g
of crystallites was related to the number of particles n within each crystallite as  with the fractal dimension D = 2.35 ± 0.15 for all values of packing volume fraction η; the fractal behaviour presumably reflects the roughness of their surfaces. The interfacial tension between the crystal and fluid phases is a key parameter that controls the nucleation process, yet γ is difficult to calculate and to measure experimentally, but one can directly measure γ by examining the statistics of the smallest nuclei. For R ≪ R
c
the surface term in Eq. 47 dominates the free energy of the crystallites, and one expects the number of crystallites to be n
cry(A) ∝ exp[− A γ/(kT)] where A is the surface area, which one approximates by an ellipsoid. The
with the fractal dimension D = 2.35 ± 0.15 for all values of packing volume fraction η; the fractal behaviour presumably reflects the roughness of their surfaces. The interfacial tension between the crystal and fluid phases is a key parameter that controls the nucleation process, yet γ is difficult to calculate and to measure experimentally, but one can directly measure γ by examining the statistics of the smallest nuclei. For R ≪ R
c
the surface term in Eq. 47 dominates the free energy of the crystallites, and one expects the number of crystallites to be n
cry(A) ∝ exp[− A γ/(kT)] where A is the surface area, which one approximates by an ellipsoid. The  (r
0 is the particle radius = 1.26 μm) and may decrease slightly with increasing η values. The γ value is in reasonable agreement with density functional calculations for hard spheres and Lennard-Jones systems. The measurement of a low value of γ is consistent with the observed rough surfaces of the crystallites; this may reflect the effects of the softer potential due to the weak charges of our particles. Approximating the critical nucleus as an ellipsoid with
(r
0 is the particle radius = 1.26 μm) and may decrease slightly with increasing η values. The γ value is in reasonable agreement with density functional calculations for hard spheres and Lennard-Jones systems. The measurement of a low value of γ is consistent with the observed rough surfaces of the crystallites; this may reflect the effects of the softer potential due to the weak charges of our particles. Approximating the critical nucleus as an ellipsoid with  , one obtains A
c
= 880 μm2
, one obtains A
c
= 880 μm2
 , and
, and  .
.
Dimensional Analysis for the Early and Later Stages of Fusion-site Expansion
The two stages of cluster fusion, a fast early and a slower later stage, were detected also in vesicle fusion. During the former the fusion site opened rapidly: the expansion velocity of the rim of the site was  . The fusion pore opens up to micrometres within a hundred microseconds. One would relate this time τearly to fast relaxation of membrane tension. The tension of the clusters achieved before fusion was in the stretching regime of the membrane. The τearly should be primarily governed by the relaxation of membrane stretching. Viscous dissipation can be associated with two contributions: in-plane dilatational shear as the fusion site expands and intermonolayer slip among the leaflets of the multilayer membrane in the fusion-site zone. The latter is negligible for fusion-site diameter L larger than half a micrometre. The τearly ∼ η
s
/σ, where η
s
is the surface dilatational viscosity coefficient of the membrane
. The fusion pore opens up to micrometres within a hundred microseconds. One would relate this time τearly to fast relaxation of membrane tension. The tension of the clusters achieved before fusion was in the stretching regime of the membrane. The τearly should be primarily governed by the relaxation of membrane stretching. Viscous dissipation can be associated with two contributions: in-plane dilatational shear as the fusion site expands and intermonolayer slip among the leaflets of the multilayer membrane in the fusion-site zone. The latter is negligible for fusion-site diameter L larger than half a micrometre. The τearly ∼ η
s
/σ, where η
s
is the surface dilatational viscosity coefficient of the membrane  with units [bulk viscosity coeffcient] × [membrane thickness] [32]. For membrane tensions
  close to the tension of rupture
  one obtains τearly ∼ η
s
/σ ∼ 100μs, in agreement with experiment
one obtains τearly ∼ η
s
/σ ∼ 100μs, in agreement with experiment  . During the later stage of the fusion process the site expansion velocity slowed down by two orders of magnitude. The dynamics was governed by the displacement of volume ΔV of fluid around the fusion site between the fused clusters. The restoring force was related to the bending elasticity of the membrane. Decay time τlate ∼ ηΔV/κ where η is the bulk viscosity coefficient of the solvent, ΔV ∼ R
3, and κ, the bending elasticity modulus of the membrane
. During the later stage of the fusion process the site expansion velocity slowed down by two orders of magnitude. The dynamics was governed by the displacement of volume ΔV of fluid around the fusion site between the fused clusters. The restoring force was related to the bending elasticity of the membrane. Decay time τlate ∼ ηΔV/κ where η is the bulk viscosity coefficient of the solvent, ΔV ∼ R
3, and κ, the bending elasticity modulus of the membrane  . For a cluster size of R = 20 μm one obtains τlate ∼ 100 s, which is the time scale measured for complete fusion-site opening. When two clusters fuse at several contact points and form some fusion sites, the coalescence of these fusion sites can lead to small, contact-zone clusters. Consider three fusion sites, which expand and touch each other in such a way that they enclose a roughly triangular segment of the contact zone. If the three sites are circular and have grown up to a diameter L
1, the enclosed contact-zone segment will form a contact-zone cluster of radius
. For a cluster size of R = 20 μm one obtains τlate ∼ 100 s, which is the time scale measured for complete fusion-site opening. When two clusters fuse at several contact points and form some fusion sites, the coalescence of these fusion sites can lead to small, contact-zone clusters. Consider three fusion sites, which expand and touch each other in such a way that they enclose a roughly triangular segment of the contact zone. If the three sites are circular and have grown up to a diameter L
1, the enclosed contact-zone segment will form a contact-zone cluster of radius  , as follows from geometric considerations. The coalescence of these several sites can lead to small contact-zone clusters encapsulating solvent. One expects that these clusters be interconnected by thin tethers, because pinching the membrane off completely would require additional energy. The fusion-induced cluster formation resembles the membrane processes during cell division, when one looks at them in a time-reversed manner. During the initial stages of the division process, the cell accumulates membrane in the form of small vesicles that define the division plane and transform into two adjacent cell membranes. From dimensional analysis it is found an appropriate time scale τ for the later stage of the expansion of the fusion site. The driving force for this expansion is provided by membrane tension σ, whereas the hydrodynamic-Stokes friction is governed by solution viscosity coefficient η. The system is characterized by two well-separated length scales: the membrane thickness l and a typical cluster size R. It is chosen R = (R
1 + R
2)/2 where R
1 and R
2 are the radii of the two clusters before they were brought into contact. The only time scale, which one can obtain from a combination of the four variables σ, η, l and R, is given by τ = (ηR/σ)f(l/R) with the dimensionless function f(l/R). Because l ≪ R one can replace f(l/R) by f(0) and ignore corrections or order (l/R). Let v (in m s−1) be the average site expansion velocity for a single site. The same order of magnitude for the average expansion velocity is deduced if one assumes that the fusion process startes with N > 1 fusion sites. The fusion sites would grow until they start to touch and coalesce. They would then create a coalesced site of diameter L if each site had grown up to L/N
1/2, which implies an average expansion velocity
, as follows from geometric considerations. The coalescence of these several sites can lead to small contact-zone clusters encapsulating solvent. One expects that these clusters be interconnected by thin tethers, because pinching the membrane off completely would require additional energy. The fusion-induced cluster formation resembles the membrane processes during cell division, when one looks at them in a time-reversed manner. During the initial stages of the division process, the cell accumulates membrane in the form of small vesicles that define the division plane and transform into two adjacent cell membranes. From dimensional analysis it is found an appropriate time scale τ for the later stage of the expansion of the fusion site. The driving force for this expansion is provided by membrane tension σ, whereas the hydrodynamic-Stokes friction is governed by solution viscosity coefficient η. The system is characterized by two well-separated length scales: the membrane thickness l and a typical cluster size R. It is chosen R = (R
1 + R
2)/2 where R
1 and R
2 are the radii of the two clusters before they were brought into contact. The only time scale, which one can obtain from a combination of the four variables σ, η, l and R, is given by τ = (ηR/σ)f(l/R) with the dimensionless function f(l/R). Because l ≪ R one can replace f(l/R) by f(0) and ignore corrections or order (l/R). Let v (in m s−1) be the average site expansion velocity for a single site. The same order of magnitude for the average expansion velocity is deduced if one assumes that the fusion process startes with N > 1 fusion sites. The fusion sites would grow until they start to touch and coalesce. They would then create a coalesced site of diameter L if each site had grown up to L/N
1/2, which implies an average expansion velocity  , still of the same order of magnitude even if N were as large as 10.
Description of the Asymptotic Coagulation–Fragmentation Equations
Finding a manageable approximation to the behaviour of the coagulation–fragmentation equations is challenging. Such an approximation is presented by means of an asymptotic analysis. Results have been checked against numerical solutions to the equations dealing with the Becker–Döring equations. Typical models for the binding energy of a n cluster follow. For rod-like aggregates,

where α kT is the monomer–monomer binding energy [33]. As it is considered the Becker–Döring model, it is taken into account reactions only between monomers and other clusters. The expression for the binding energy is suitable for aggregates of certain kinds of lipids, when these form rod-like clusters. The molecules of these lipids typically have a hydrophilic head and a hydrophobic tail so, in aqueous solution, they spontaneously arrange themselves so that tails are away from the surrounding water, and heads, in contact with it. Depending on the shape of the particular molecule, they can form spherical aggregates with tails pointing inwards and heads pointing outwards, or form lipid bilayers, where lipid molecules form a double layer with heads on the external surface and tails on the inside. Clusters formed by lipids in aqueous solution are called micelles, and the process by which they form is called micellization. To determine the time scale, one needs a measure of the kinetic coefficient of the d decay reaction, which was set equal to one. A convenient relation could be an equation, which in dimensional units is  . In case the self-similar size distribution is not reached during the intermediate phase, another way to determine d is to study the equilibration era and compare the experimental size distribution with the numerical solution of the model. By combining τearly ∼ η
s
/σ with
. In case the self-similar size distribution is not reached during the intermediate phase, another way to determine d is to study the equilibration era and compare the experimental size distribution with the numerical solution of the model. By combining τearly ∼ η
s
/σ with  it is obtained
  . The original software used in the investigation is available from the authors.
Calculation Results
Table 1 reports the packing efficiencies, packing-efficiency correction factors, as well as the numerical values of the A′, B′ and C 0 parameters determining the energy of interaction for molecules.
Figure 1 illustrates the equilibrium difference between the Gibbs free energies of interaction of an SWNT with its surroundings, in the solid phase and in the cluster volume, or on the cluster surface. On going from C60 (droplet model) to SWNT (bundlet model) the minimum is less marked (55% of droplet model), which causes a lesser number of units in SWNT  than in C60 clusters
  . Moreover, the abscissa is also shorter in SWNT
  than in C60 clusters
  . In turn, when the packing-efficiency correction (Eq. 7) is included, the C60–SWNT shortening decreases (68% of droplet model) while keeping
  and
and  .
.

Energy of interaction of an SWNT with its surroundings in the cluster volume or surface
The temperature dependence of the solubility of SWNT (cf. Fig. 2) shows that the solubility decreases with temperature, because solubility is due to cluster formation. At  , the C60 crystal presents an orientation disorder phase transition from FCC characterized by close packing to simple cubic lattice. The reduction is less marked for SWNT in agreement with the lesser number of units in SWNT clusters. In particular, at T = 260 K on going from C60 (droplet model) to SWNT (bundlet model) the solubility drops to 1.6% of droplet. In turn when the packing-efficiency correction is included (Eq. 7) the shortening decreases (2.6% of droplet model). The results for SWNT bundlet model with packing-efficiency correction with
  extrapolation are superposed to SWNT bundlet model with
  extrapolation.

Temperature dependence of solubility of C60 (droplet) and SWNT (bundlet model without and with η-correction)
The concentration dependence of the heat of solution in toluene, benzene and CS2, calculated at solvent temperatureT= 298.15 K (cf. Fig. 3), shows that for C60 (droplet model), on going from a concentration of solution less than 0.1% of saturated (containing only isolated fullerene molecules) to that with concentration 15% (containing clusters of average size 7), the heat of solution decreases by 73%. In turn for SWNT (bundlet model) the heat of solution increases by 98% in the same interval. However, when the packing-efficiency correction (Eq. 7) is included, the increment in the heat of solution is reduced to 54% in the same interval. Apparently, the discrepancy between various experimental data on the heat of solution of fullerenes and SWNTs may be ascribed to such a sharp concentration dependence of the heat of solution of fullerenes and SWNTs. The results for SWNT bundlet model with packing-efficiency correction with n → ∞ extrapolation are superposed to SWNT bundlet model with n → ∞ extrapolation.

Concentration dependence of the heat of solution in toluene, benzene and CS2 at T= 298.15 K of C60 and SWNT
The results for the dependence of the diffusion coefficientD with concentrationC in toluene, atT= 298.15 K (cf. Fig. 4), show that the cluster formation in a solution close to saturation leads to a decrease in D by 58%, 73% and 69% for C60, SWNT and SWNT with packing-efficienty correction, respectively, as compared with D
0 for a SWNT. For SWNT (bundlet) D decreases by 35% with regard to the droplet model. In turn when the packing-efficiency correction (Eq. 7) is included the decrease is reduced to 27%. The discrepancy between experimental data, on fullerene-SWNT D, may be due to the sharp concentration dependence of D for these systems. The results for SWNT bundlet model with packing-efficiency correction with  extrapolation are superposed to SWNT bundlet model with
  extrapolation.

Concentration dependence of the diffusion coefficient of C60 and SWNT in toluene at T= 298.15 K
Conclusions
The following conclusions can be made from this study.
-
1.
For a cluster nature of SWNT solubility to be completely established direct experimental exploration is necessary. The measurements of infrared absorption spectra of an SWNT solution, involving concentrations at various temperatures and a constant optical path length, can be conceived; the dependence will indicate the presence of clusters in solution. According to Raoult’s law, the saturation vapour pressure of a solvent above a solution differs from that above a pure solvent by a value proportional to solute-particle concentration. The solvent vapour flow will enable the dependence of solute particle concentration. If the dependence is nonlinear it will indicate the existence of clusters in solution.
-
2.
The C60aggregation in benzene is reversible and (C60) n exhibits a loose structure. The experimental results confirm the variation of cluster-size distribution. The structure of (C60) n changes from compact spherelike to larger and looser clusters. The formation of fullerene-SWNT clusters is rapid (∼10−6 s), while their growth process, slow (∼ 106 s). The key for the explanation of process nature is found, what makes thinking that the clustersheath is filled with numerous pores. The establishment of themembranous character of growth process in clusters allows explaining the high experimental data dispersion.
-
3.
During the latter stage of the fusion process the site expansion velocity slowed down by two orders of magnitude. The dynamics were governed mainly by the displacement of the volume of liquid around the fusion site between the fused clusters, which is confirmed by dimensional analysis. The same order of magnitude for the average cluster-fusion velocity is deduced if the fusion process starts with several fusion sites, even if there were as much as 10 sites.
-
4.
Based on a simple kinetic model and starting from the initial state of pure monomers, micellization of rod-like aggregates at high critical micelle concentration occurs in three separated stages. In the first era many small clusters are produced while the number of monomers decreases sharply. During the second era aggregates are increasing steadily in size, and their distribution approaches a self-similar solution of the diffusion equation. Before the continuum limit can be realized the average size of the nuclei becomes comparable to its equilibrium value, and a simple mean-field Fokker–Planck equation describes the final era until the equilibrium distribution is reached. A continuum size distribution does not describe micellization until the third era has started; during the first two eras the effects of discreteness dominate the dynamics. To validate the theory by an experiment, it would be important to measure the average cluster size as a function of time. To determine the time scale one needs a measure of kinetic coefficientd of decay reaction. A convenient relation could be an equation, which in dimensional units is
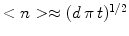 . In case the self-similar size distribution is not reached during the intermediate phase, another way to determined is to study the equilibration era and compare the experimentally obtained size distribution with the numerical solution of the model. At equilibrium
 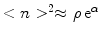 , which determines dimensionless binding energy α.
 -
5.
By combining two expressions for τearly it is obtained
 .
.
 . In case the self-similar size distribution is not reached during the intermediate phase, another way to determined is to study the equilibration era and compare the experimentally obtained size distribution with the numerical solution of the model. At equilibrium
  , which determines dimensionless binding energy α.
 .
.It has not escaped our notice a droplet cluster model of conical single-wall carbon nanohorns (SWNHs), following modified Eqs. 1′–48′.


where ηcon is the packing efficiency of cones, e.g., for a solid angle of 1sr, ηcon = (1−1/π)1/2. As ηsph < ηcon < ηcyl, the behaviour of conical SWNHs is expected to be intermediate between spherical fullerenes and cylindrical SWNTs.


where  , the surface tension, and v = V/M, the molecular volume
  .
.
References
Ruoff RS, Malhotra R, Huestis DL, Tse DS, Lorents DC: Nature (London). 1993, 362: 140. COI number [1:CAS:528:DyaK3sXhslKqsrw%3D] 10.1038/362140a0
Blau WJ, Byrne HJ, Cardin DJ, Dennis TJ, Hare JP, Kroto HW, Taylor R, Walton DRM: Phys. Rev. Lett.. 1991, 67: 1423. COI number [1:CAS:528:DyaK3MXlslSgt7Y%3D] 10.1103/PhysRevLett.67.1423
Sun Y-P, Bunker CE: Nature (London). 1993, 365: 398. COI number [1:CAS:528:DyaK3sXmsFymtbg%3D] 10.1038/365398a0
Ghosh HN, Sapre AV, Mittal JP: J. Phys. Chem.. 1996, 100: 9439. COI number [1:CAS:528:DyaK28XivVClurw%3D] 10.1021/jp9535046
Ying Q, Marecek J, Chu B: Chem. Phys. Lett.. 1994, 219: 214. COI number [1:CAS:528:DyaK2cXit1yhs7w%3D] 10.1016/0009-2614(94)87047-0
Ying Q, Marecek J, Chu B: J. Chem. Phys.. 1994, 101: 2665. COI number [1:CAS:528:DyaK2cXmslSit7c%3D] 10.1063/1.467646
Painter PC, Opaprakasit P, Scaroni A: Energy Fuels. 2000, 14: 1115. COI number [1:CAS:528:DC%2BD3cXlslKisbg%3D] 10.1021/ef000092d
Scrivens WA, Tour JM, Creek KE, Pirisi L: J. Am. Chem. Soc.. 1994, 116: 4517. COI number [1:CAS:528:DyaK2cXlsVyqurc%3D] 10.1021/ja00089a067
Fortner JD, Lyon DY, Sayes CM, Boyd AM, Falkner JC, Hotze EM, Alemany LB, Tao YJ, Guo W, Ausman KD, Colvin VL, Hughes JB: Environ. Sci. Technol.. 2005, 39: 4307. COI number [1:CAS:528:DC%2BD2MXjs1SitLY%3D] 10.1021/es048099n
G.V. Andrievsky, M.V. Kosevich, O.M. Vovk, V.S. Shelkovsky, L.A. Vashchenko, J. Chem Soc. Chem. Commun. 1281 (1995)
Deguchi S, Alargova RG, Tsujii K: Langmuir. 2001, 17: 6013. COI number [1:CAS:528:DC%2BD3MXlvVOls7s%3D] 10.1021/la010651o
Andrievsky GV, Klochkov VK, Bordyuh AB, Dovbeshko GI: Chem. Phys. Lett.. 2002, 364: 8. COI number [1:CAS:528:DC%2BD38XntVWktr0%3D] 10.1016/S0009-2614(02)01305-2
T. Andersson, K. Nilsson, M. Sundahl, G. Westman, O. Wennerstro¨m, J. Chem. Soc., Chem. Commun. 604 (1992)
Sundahl M, Andersson T, Nilsson K, Wennerström O, Westman G: Synth. Met.. 1993, 56: 3252. COI number [1:CAS:528:DyaK2cXhvVSiuw%3D%3D] 10.1016/0379-6779(93)90111-9
Hungerbühler H, Guldi DM, Asmus K-D: J. Am. Chem. Soc.. 1993, 115: 3386. 10.1021/ja00061a070
Y.N. Yamakoshi, T. Yagami, K. Fukuhara, S. Sueyoshi, N. Miyata, J. Chem Soc., Chem. Commun. 517 (1994)
Scott GD, Charlesworth AM, Mak MK: J. Chem. Phys.. 1964, 40: 611. COI number [1:CAS:528:DyaF2cXkt1Cnug%3D%3D] 10.1063/1.1725176
Scott GD, Kilgour DM: Br. J. Appl. Phys.. 1969, 2: 863.
Baram A, Luban M: J. Phys. C Solid State Phys.. 1979, 12: L659. COI number [1:CAS:528:DyaL3cXkslCmtw%3D%3D] 10.1088/0022-3719/12/17/005
Torrens F, Castellano G: Comput. Lett.. 2005, 1: 331. COI number [1:CAS:528:DC%2BD28XhtFals7jO] 10.1163/157404005776611303
F. Torrens, G. Castellano, Microelectron. J., in press
Torrens F, Castellano G: J. Comput. Theor. Nanosci.. 2007, 4: 588. 10.1166/jctn.2007.020
Bezmel’nitsyn VN, Eletskii AV, Stepanov EV: J. Phys. Chem.. 1994, 98: 6665. 10.1021/j100078a001
V.N. Bezmel’nitsyn, A.V. Eletskii, E.V. Stepanov: Zh. Fiz. Khim.. 1995, 69: 735.
Bezmel’nitsyn VN, Eletskii AV, Okun’ MV: Physics–Uspekhi. 1998, 41: 1091.
Bezmel’nitsyn VN: Khim. Fiz.. 1994,13(12):156.
Bezmel’nitsyn VN: Phys. Scr.. 1996, 53: 364. COI number [1:CAS:528:DyaK28XhslCkur8%3D] 10.1088/0031-8949/53/3/017
Bezmel’nitsyn VN: Tech. Phys.. 1996, 41: 986.
Bezmel’nitsyn VN: Phys. Scr.. 1996, 53: 368. COI number [1:CAS:528:DyaK28XhslCkurw%3D] 10.1088/0031-8949/53/3/018
Eletskii AV, Okun’ MV, Smirnov BM: Phys. Scr.. 1997, 55: 363. COI number [1:CAS:528:DyaK2sXhvFent7Y%3D] 10.1088/0031-8949/55/3/016
Gasser U, Weeks ER, Schofield A, Pusey PN, Weitz DA: Science. 2001, 292: 258. COI number [1:CAS:528:DC%2BD3MXivVyhtLo%3D] 10.1126/science.1058457
Haluska CK, Riske KA, Marchi-Artzner V, Lehn J-M, Lipowsky R, Dimova R: Proc. Natl. Acad. Sci. USA. 2006, 103: 15841. COI number [1:CAS:528:DC%2BD28XhtFymur%2FI] 10.1073/pnas.0602766103
Neu JC, Cañizo JA, Bonilla LL: Phys. Rev. E. 2002, 66: 61406. COI number [1:CAS:528:DC%2BD3sXltVahsw%3D%3D] 10.1103/PhysRevE.66.061406
Acknowledgements
The authors acknowledge financial support from the Spanish MEC DGCyT (Project No. CTQ2004-07768-C02-01/BQU), EU (Program FEDER) and Generalitat Valenciana (DGEUI INF01-051, INFRA03-047, OCYT GRUPOS03-173 and COMP06-147).
Author information
Authors and Affiliations
Corresponding author
Rights and permissions
This article is published under an open access license. Please check the 'Copyright Information' section either on this page or in the PDF for details of this license and what re-use is permitted. If your intended use exceeds what is permitted by the license or if you are unable to locate the licence and re-use information, please contact the Rights and Permissions team.
About this article
Cite this article
Torrens, F., Castellano, G. Asymptotic Analysis of Coagulation–Fragmentation Equations of Carbon Nanotube Clusters. Nanoscale Res Lett 2, 337 (2007). https://doi.org/10.1007/s11671-007-9070-8
Received:
Accepted:
Published:
DOI: https://doi.org/10.1007/s11671-007-9070-8